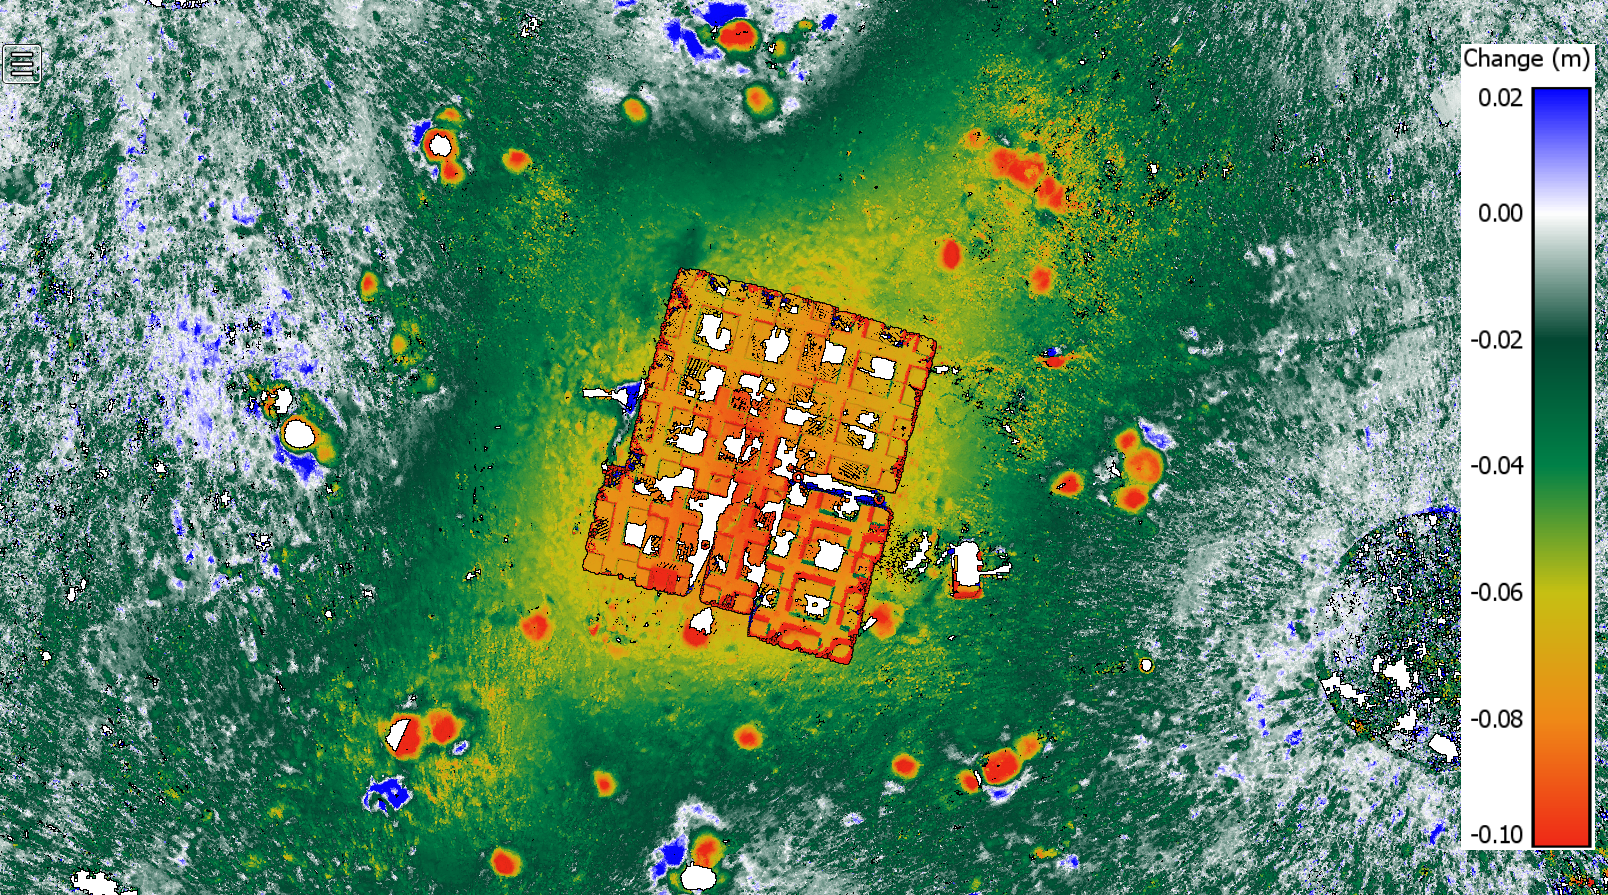
After a recent trip to Christchurch, New Zealand in December 2019 to collect lidar data before and after blast-induced liquefaction testing. I created a web visualization of the data using potree.
 Screenshot showing change comparison of data collected before and after blast-induced liquefaction testing within a potree web viewer
The viewer containing before, after, and change analysis of the data can be found here.